Social Distancing Scorecard Worst Offenders List (Global Locations)
Author : Big Byte Insights
In our dashboard (bigbyteinsights.com/covid19), “AQ - Lockdown Location” and “AQ - Lockdown City” tabs could be used to identify locations/cities where human activity is high and perhaps the residents should practice more social distancing there.
We are using the OpenAQ (https://openaq.org/) pollution data (specifically PM2.5) as a proxy of human activity. Essentially, if the difference between PM2.5 level today and the average level during the same month last year is negative, then we are assuming that people are practicing social distancing as there is likely less human activity today versus last year. Conversely, a higher reading this year versus the prior year’s monthly average may indicate that there is more human activity at those locations and people may not be observing social distancing. Admittedly, this methodology is an approximation and may not work at every location due to special circumstances. One example of such a situation would be a fire burning near the monitor while the entire locality is observing social distancing. However, on average, we expect that the year over year change in PM2.5 to be reflective of human activity.
We acknowledge that there are better ways to estimate social distancing, such as using cell phone locations to calculate average distance traveled or using a large network of cameras to monitor human movement. However, it is difficult to get access to location data on a global level (unless your company name is Google or Apple) or to deploy a large number of cameras in a reasonable amount of time / budget. Moreover, in certain parts of the world “big brother” concerns over surveillance would be a major impediment to implementing these techniques. Under such circumstances, we think Air Quality data is a practical way to identify locations that need to practice greater social distancing.
Below, we present a ranking of locations (excluding locations in China) with much higher PM2.5 levels over the 3 days ended 4/15/20 versus levels a year ago.
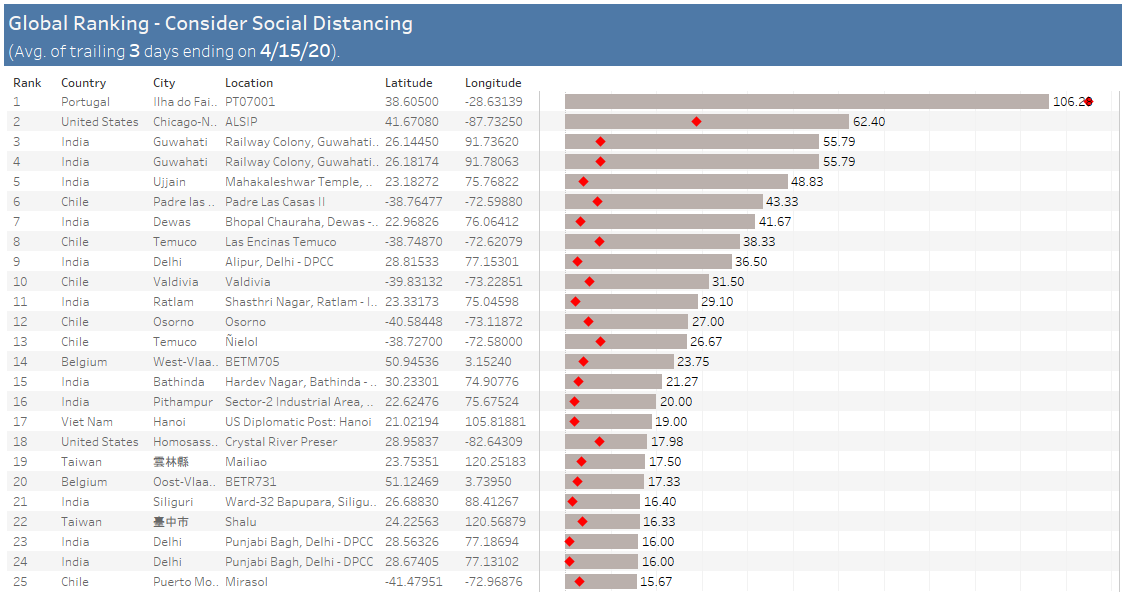
Please note, the same location might appear multiple times if it has multiple lat/long coordinates.
Methodology: -
AQ data has been cleaned for obvious errors in data collection.
For aggregating AQ data, we have adhered to only doing like-for-like comparisons. So essentially, if there is a reading from a location both today and last year, then we calculate the Y/Y change. Only the Y/Y change of these locations is used to calculate the Y/Y change for Cities and Countries. In other words, new monitors that were not present last year do not impact our Y/Y metric for Cities / Countries. For some countries, OpenAQ began reporting data within the last 12 months. As a result, we are unable to calculate the Y/Y change (these countries are not available in the dropdown lists in AQ tabs).